
Compare your investment goals with a quantified trajectory
Building an emergency reserve, changing an allocation or tracking an income target takes more than a desired amount. My Wealth connects each goal with your wealth data, planned contributions and assumptions.
You can see the remaining gap, explore a trajectory and observe what changes when you adjust a scenario. Projections are conditional estimates, with no guarantee of returns or of reaching the target.
1. Three types of target for different questions
| Your question | Goal type |
|---|---|
| What contribution is needed for the amount I want to reach? | Target value |
| How can I direct future contributions towards a chosen allocation? | Target allocation |
| How close am I to my desired passive income? | Target passive income |
Each goal has a defined scope: an asset, a holding account or a selection, depending on the options for the chosen type. A specific target is therefore compared with the data relevant to it.
2. An example visible in the application: an 18,000 USD reserve
The following screenshots use the dollar-denominated demonstration wealth file. They illustrate how the application works, not an investment recommendation.
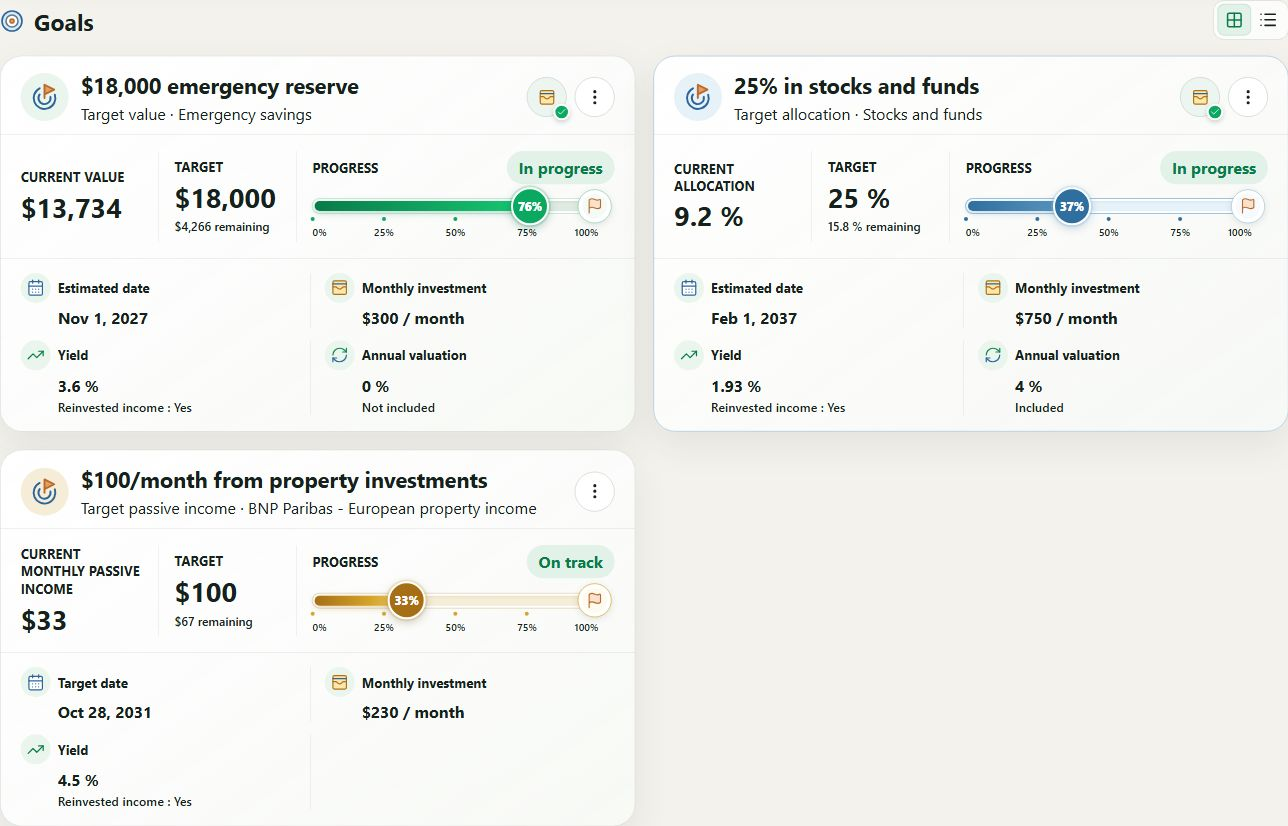
The first card shows the settings and result for the same goal:
| Setting or result | Value shown in the example |
|---|---|
| Current reserve | 13,734 USD |
| Target | 18,000 USD |
| Remaining gap | 4,266 USD |
| Planned contribution | 300 USD per month |
| Return assumption | 3.6%, income reinvested |
| Annual capital appreciation | Not included in this goal |
| Displayed estimated completion date | 1 November 2027 |
The card shows 76% progress. This date and percentage correspond to the screenshot's data and assumptions; they will change if you adjust the scenario.
The other two cards illustrate different needs: directing future contributions towards a 25% allocation to shares and funds, and targeting 100 USD in monthly income within a property-related scope.
3. Visualise the effect of contributions on the projection
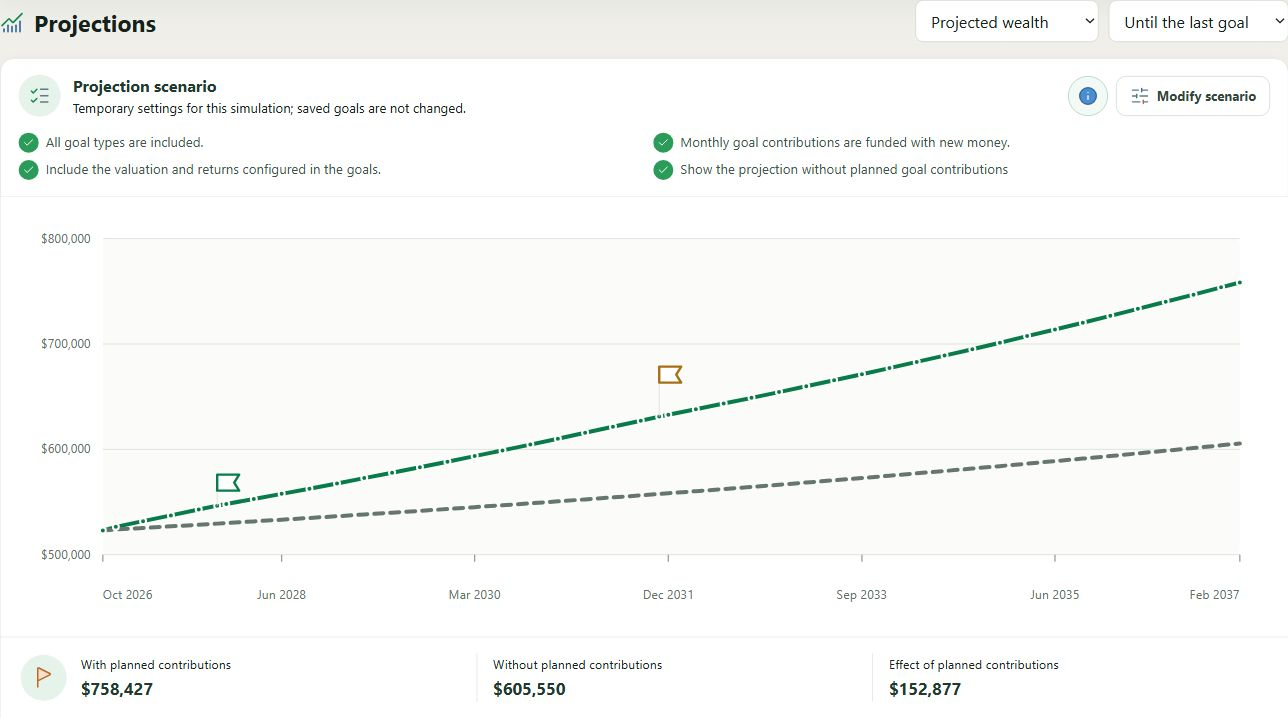
At the horizon shown in this scenario, the projection indicates:
| Trajectory | Projected value |
|---|---|
| With planned contributions | 758,427 USD |
| Without those contributions | 605,550 USD |
| Difference between the two trajectories | 152,877 USD |
This difference shows the cumulative effect of contributions in the scenario under the selected assumptions. It is neither a guaranteed return nor simply the gross sum of contributions.
Milestones show the goals' calculable completion dates. Comparing the trajectories lets you see what contributions change rather than reading only a final value.
4. Keep assumptions visible when comparing
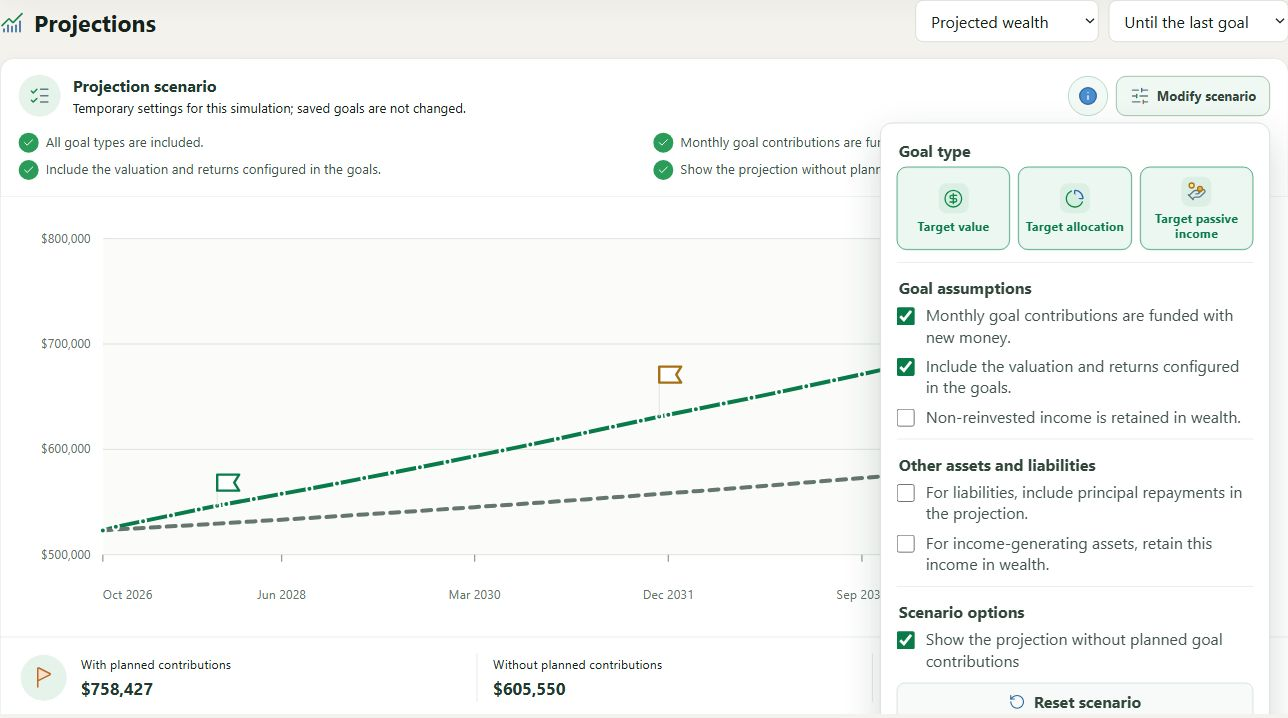
In this example, goal types, new contributions, configured returns and the trajectory without contributions are enabled. Optional settings for other income and repayment of liabilities remain disabled.
You can temporarily change these settings to compare trajectories without changing saved goals. Required exchange rates, dates and data must be available. Goals that overlap or use incompatible assumptions need checking.
A target allocation concerns future contributions: My Wealth does not automatically sell portfolio assets to achieve it. The goals guide explains the calculations and scenario options.
5. Compare planned contributions with your budget
In the demonstration cards, the three monthly contributions total 1,280 USD. Two goals are linked to the budget for 1,050 USD in planned contributions: the summary distinguishes defined goals from those actually linked to a budget account.
You can therefore compare your plan with available capacity and the amount already invested during the month. The Budget and wealth page explains this connection.
To save your own goals, download My Wealth. For an income target, also see passive income tracking.