
How much does your wealth earn each month?
The value of your investments alone does not tell you what they generate. Between rent, dividends, interest, expenses and loan repayments, an income total can conceal very different situations.
My Wealth brings income from your assets into a dedicated view. You can compare income before and after loans, identify the main contributors and track the gap to your monthly target.
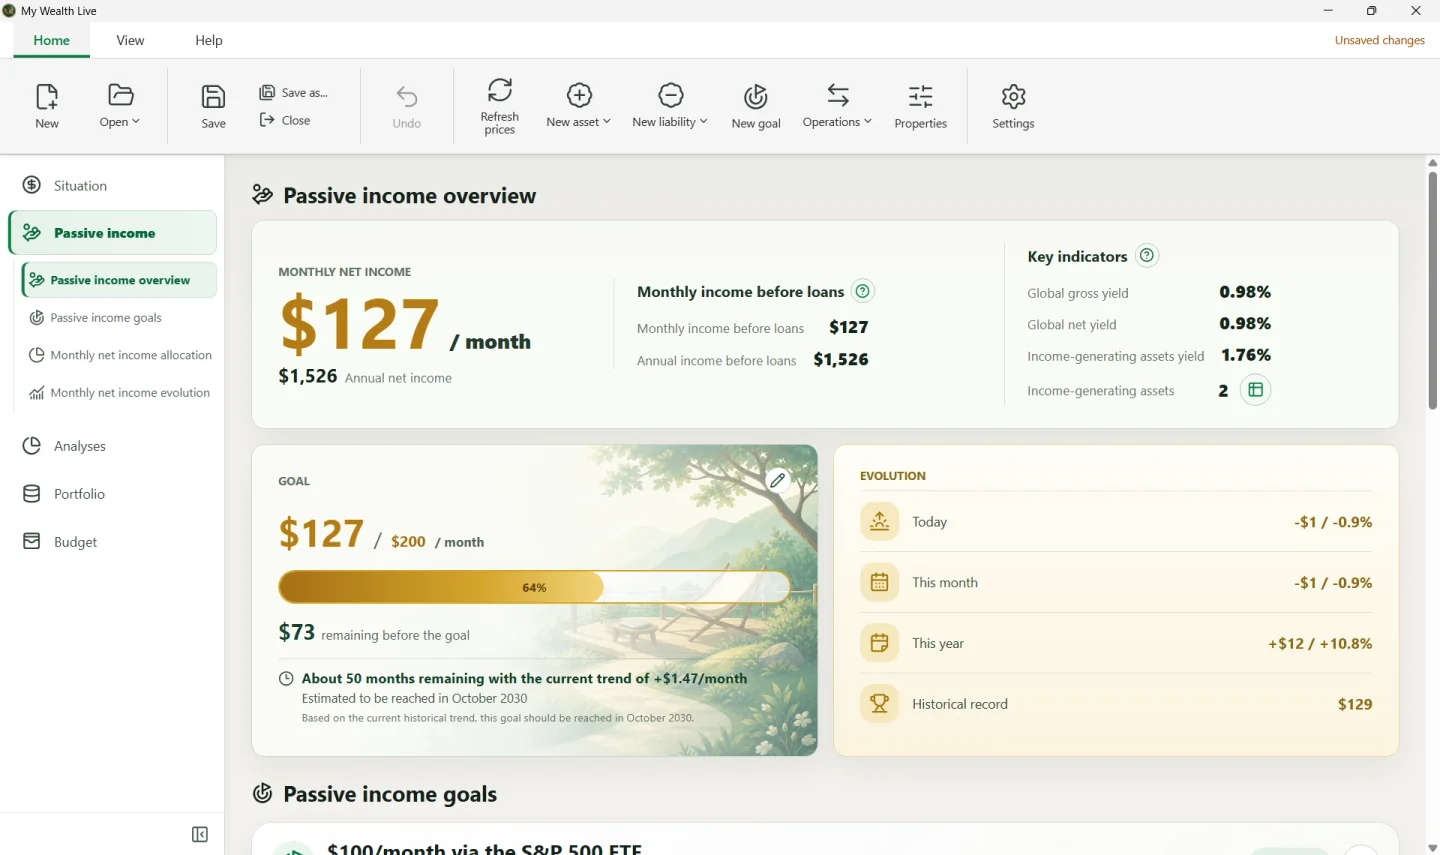
1. Read available income beyond the headline amount
In the fictional wealth file shown, the displayed monthly amounts are:
| View | Amount | Interpretation |
|---|---|---|
| Income before loans | 1,557 USD | Income calculated before taking financing into account |
| Net income after loans | 589 USD | Income after taking associated loans into account |
| Monthly target | 1,500 USD | The chosen reference for tracking progress |
| Gap to target | 911 USD | The difference between the target and displayed net income |
Net income covers around 39% of the target. The 1,557 USD before loans must not automatically be treated as gross income before all expenses: the calculation's components matter.
The amounts and percentages in this screenshot are rounded and illustrate demonstration data. The result depends on the income, expenses, frequencies and financing entered.
2. Find the assets that contribute most
The view lets you move from the total to the origin of the income. In this example, the Manchester rental flat contributes 372 USD per month, or around 63% of total net income.
This raises a different question from yield: how much of your income depends on a single property or investment? Wealth diversified by value may still have highly concentrated income.
You can explore groupings by asset, asset class, institution, holding account or owner. The relationship between each income stream and its asset makes associated expenses and loans easier to understand.
The Multi-asset portfolio tracking page complements this view with value and ownership allocations.
3. Compare rent, dividends and interest on a common basis
Income is not always paid at the same frequency. Monthly rent and an annual dividend need to be converted to a comparable period before being added together.
My Wealth uses the entered frequencies to display monthly and annual equivalents. Recurring expenses associated with assets are also included in the calculation.
A monthly equivalent helps compare investments; it does not mean the same amount will actually arrive in your account every month. To plan due dates and cash flow, use the monthly budget.
4. Distinguish income, yield and changes in value
These three views answer different questions:
| Indicator | Question it answers |
|---|---|
| Income | How much do my assets generate? |
| Yield | How does that income compare with the value used? |
| Change in wealth | How does the value of my assets and debts change? |
An asset can rise in value without paying income. Conversely, high income alone says nothing about risk, availability or debt. Wealth analyses help keep these dimensions in mind.
The guide to understanding your position explains the indicators and settings in the Passive income view.
5. Track an overall target or prepare a specific goal
The monthly target in the Passive income view provides a reference for your overall wealth. You can adjust it and observe the gap to calculated income.
An investment goal addresses a more detailed need: a defined set of assets, contributions and specific assumptions for targeting an income level. The two approaches complement each other.
Estimates rely on the available data and assumptions. A configured yield or historical income does not guarantee future payments.
6. Keep income and wealth in the same file
Income, frequencies and expenses remain associated with the wealth file. You can correct them as your situation changes and retain your tracking alongside assets and liabilities.
My Wealth's essential features are free. Local operation lets you choose where to save and back up your data.
To track your own income, download My Wealth.