
Understanding your wealth analyses
The Analyses page presents seven complementary views of your wealth: statistics, availability, concentration, debt, and three indicative rankings. It uses the values in the document without changing assets, liabilities, or supports.
Start by checking the data
Before interpreting an analysis, check under Situation that current values, liabilities, and currency conversions are consistent. A partial total or incorrect data may also make the analysis partial or misleading.
Results may depend in particular on the reference country, asset countries, supports, holding structures, currencies, and entered values.
Statistics
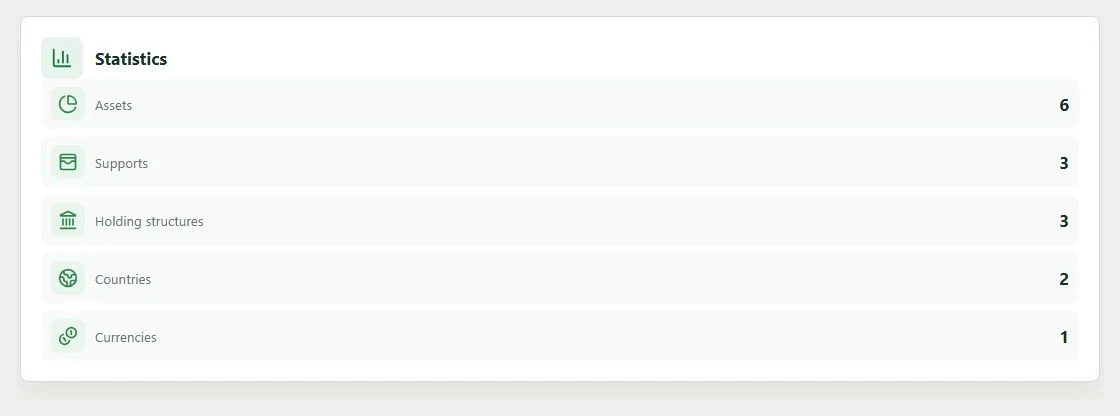
The Statistics card counts the items that contribute to positive gross wealth across five dimensions:
- number of valued assets;
- number of represented supports;
- number of represented holding structures;
- number of represented countries;
- number of represented currencies.
An Unspecified category counts as a group when a support, holding structure, or country is missing. This card therefore measures the variety of the available data, not its balance: ten assets can remain heavily concentrated in a single position.
Wealth availability
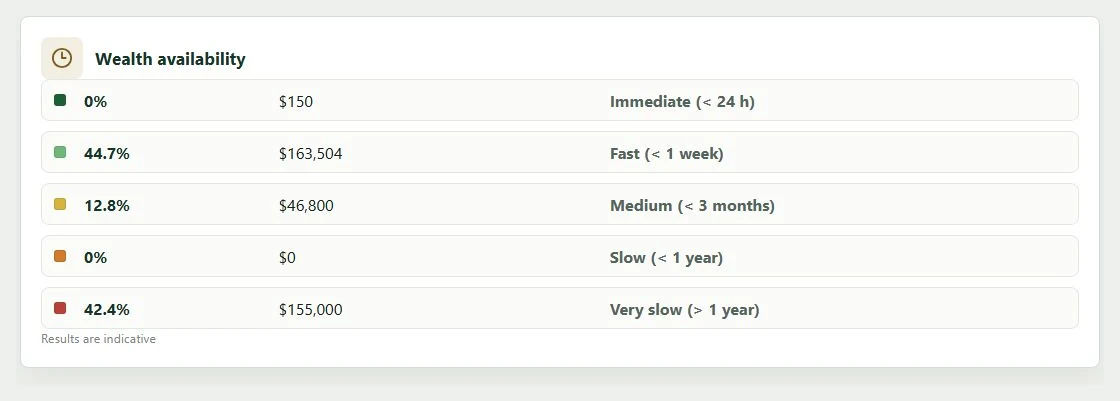
Availability divides asset value according to how soon it can be accessed:
- Immediate: under 24 hours;
- Fast: under one week;
- Medium: under three months;
- Slow: under one year;
- Very slow: over one year.
Current and savings accounts are generally immediate, stocks, funds, and cryptocurrencies fast, while property is classed as very slow. Other families use a timeframe suited to their type.
Each row displays the corresponding share and amount in the main currency. To estimate the share that can be accessed quickly, add only Immediate and Fast. A debt associated with property or REIT fund (SCPI) shares reduces the available value of that asset in this analysis.
A missing conversion may prevent an asset's value from being included. Correct the pair under Properties > Exchange rates.
Wealth concentration
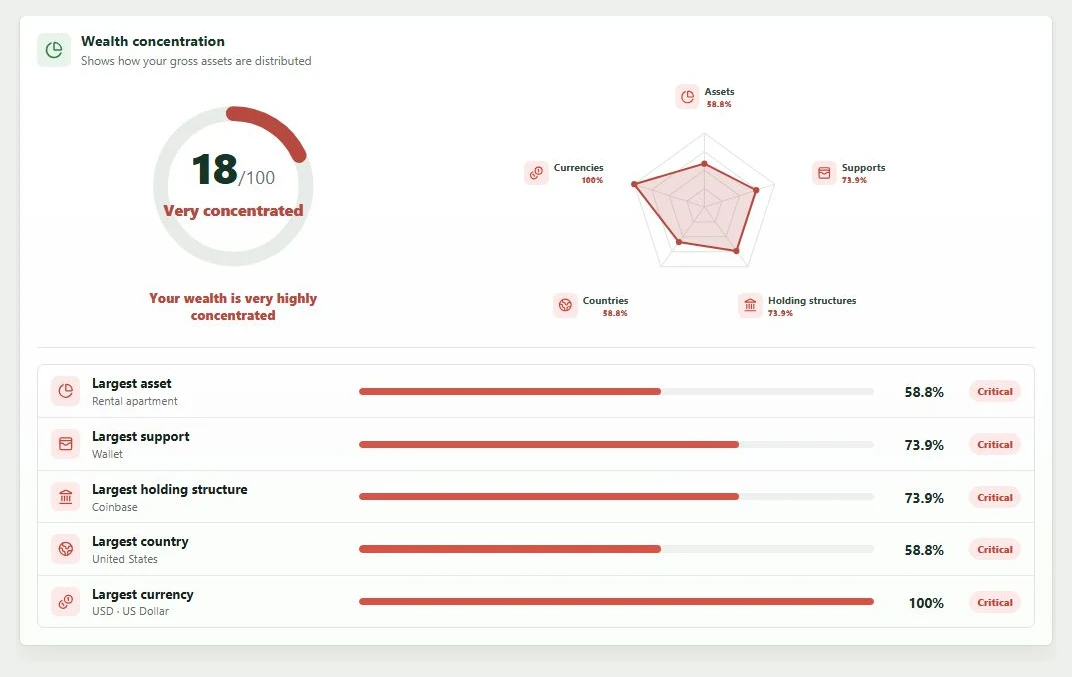
Concentration measures the weight of the largest position across five dimensions: assets, supports, holding structures, countries, and currencies. Each row gives the dominant item, its percentage, and a concentration-risk level.
The diversification score combines these five dimensions, with greater weight given to concentration by asset. The radar highlights the dimensions that are least distributed.
The calculation uses only positive gross values. Liabilities and loans do not reduce the displayed exposure: they are examined separately in the debt card.
Wealth debt
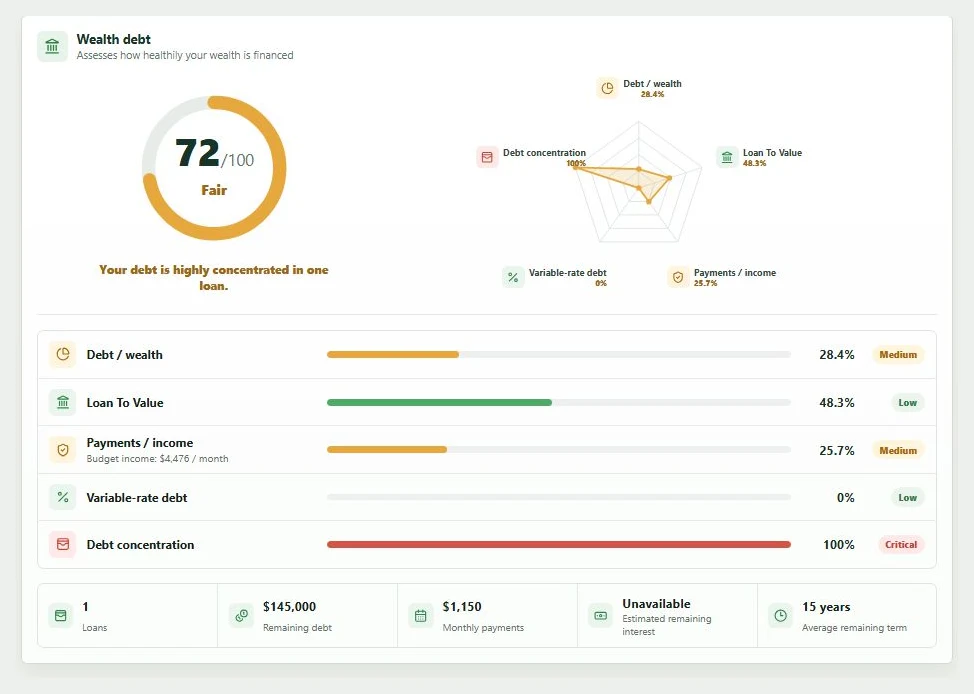
The debt card brings together five indicators:
- the ratio of remaining debt to gross asset value;
- the ratio of loans to the value of the assets they finance;
- the weight of monthly payments relative to income configured in the budget;
- the share of debt exposed to a variable rate;
- the share represented by the largest loan.
The score and radar summarise these indicators. The lower section also gives the number of loans, remaining principal, monthly payments, remaining interest, and average term when this information can be calculated.
Check outstanding principal, due dates, rate type, and associated assets. Without income configured in the budget, the payment burden relative to income is shown as not applicable; the other dimensions remain available.
National ranking
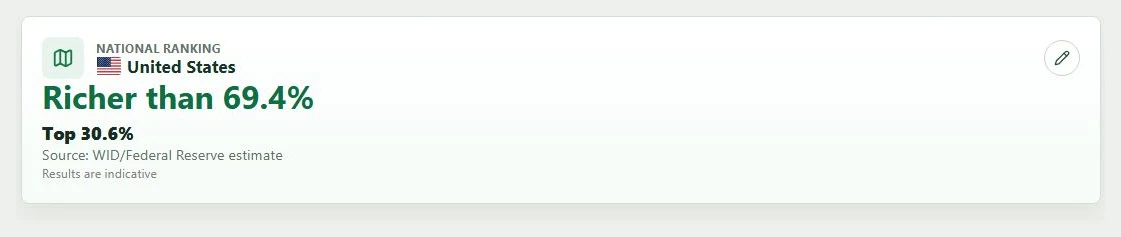
The national ranking compares net wealth with statistical thresholds for the reference country. It states the share of the population with less wealth or the corresponding upper bracket.
The displayed country is selected under Properties. Use the card's edit button to change it. Net wealth is converted into the source's currency before comparison; an unavailable conversion makes the ranking unavailable.
The source is shown at the bottom of the card. The result remains indicative: years, methods, statistical units, and definitions of wealth may differ from your situation.
International comparison
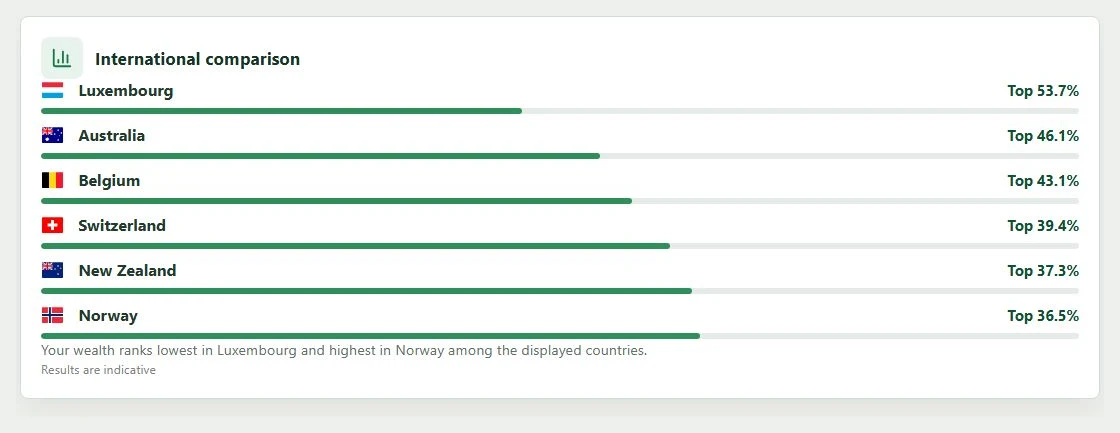
The international comparison applies the same net wealth to several countries after converting it into their reference currency. It displays up to six available results, ranked from the lowest to highest percentile.
This card shows that the same amount does not represent the same position in every country. It compares neither cost of living, taxation, nor investment returns. A country is absent when the required conversion or ranking data is unavailable.
World

The World card places net wealth within the global distribution and displays the corresponding bracket, such as the upper half or a percentage among the highest levels of wealth.
As with country rankings, the amount is first converted into the currency used by the source. The result is a statistical order of magnitude, not an assessment of living standards, purchasing power, or financial security.
Do not turn analysis into a recommendation
The indicators describe the document based on the entered data. They are not investment recommendations and do not guarantee that an allocation or risk level is suitable for your situation.